Prometheus, without a second agent
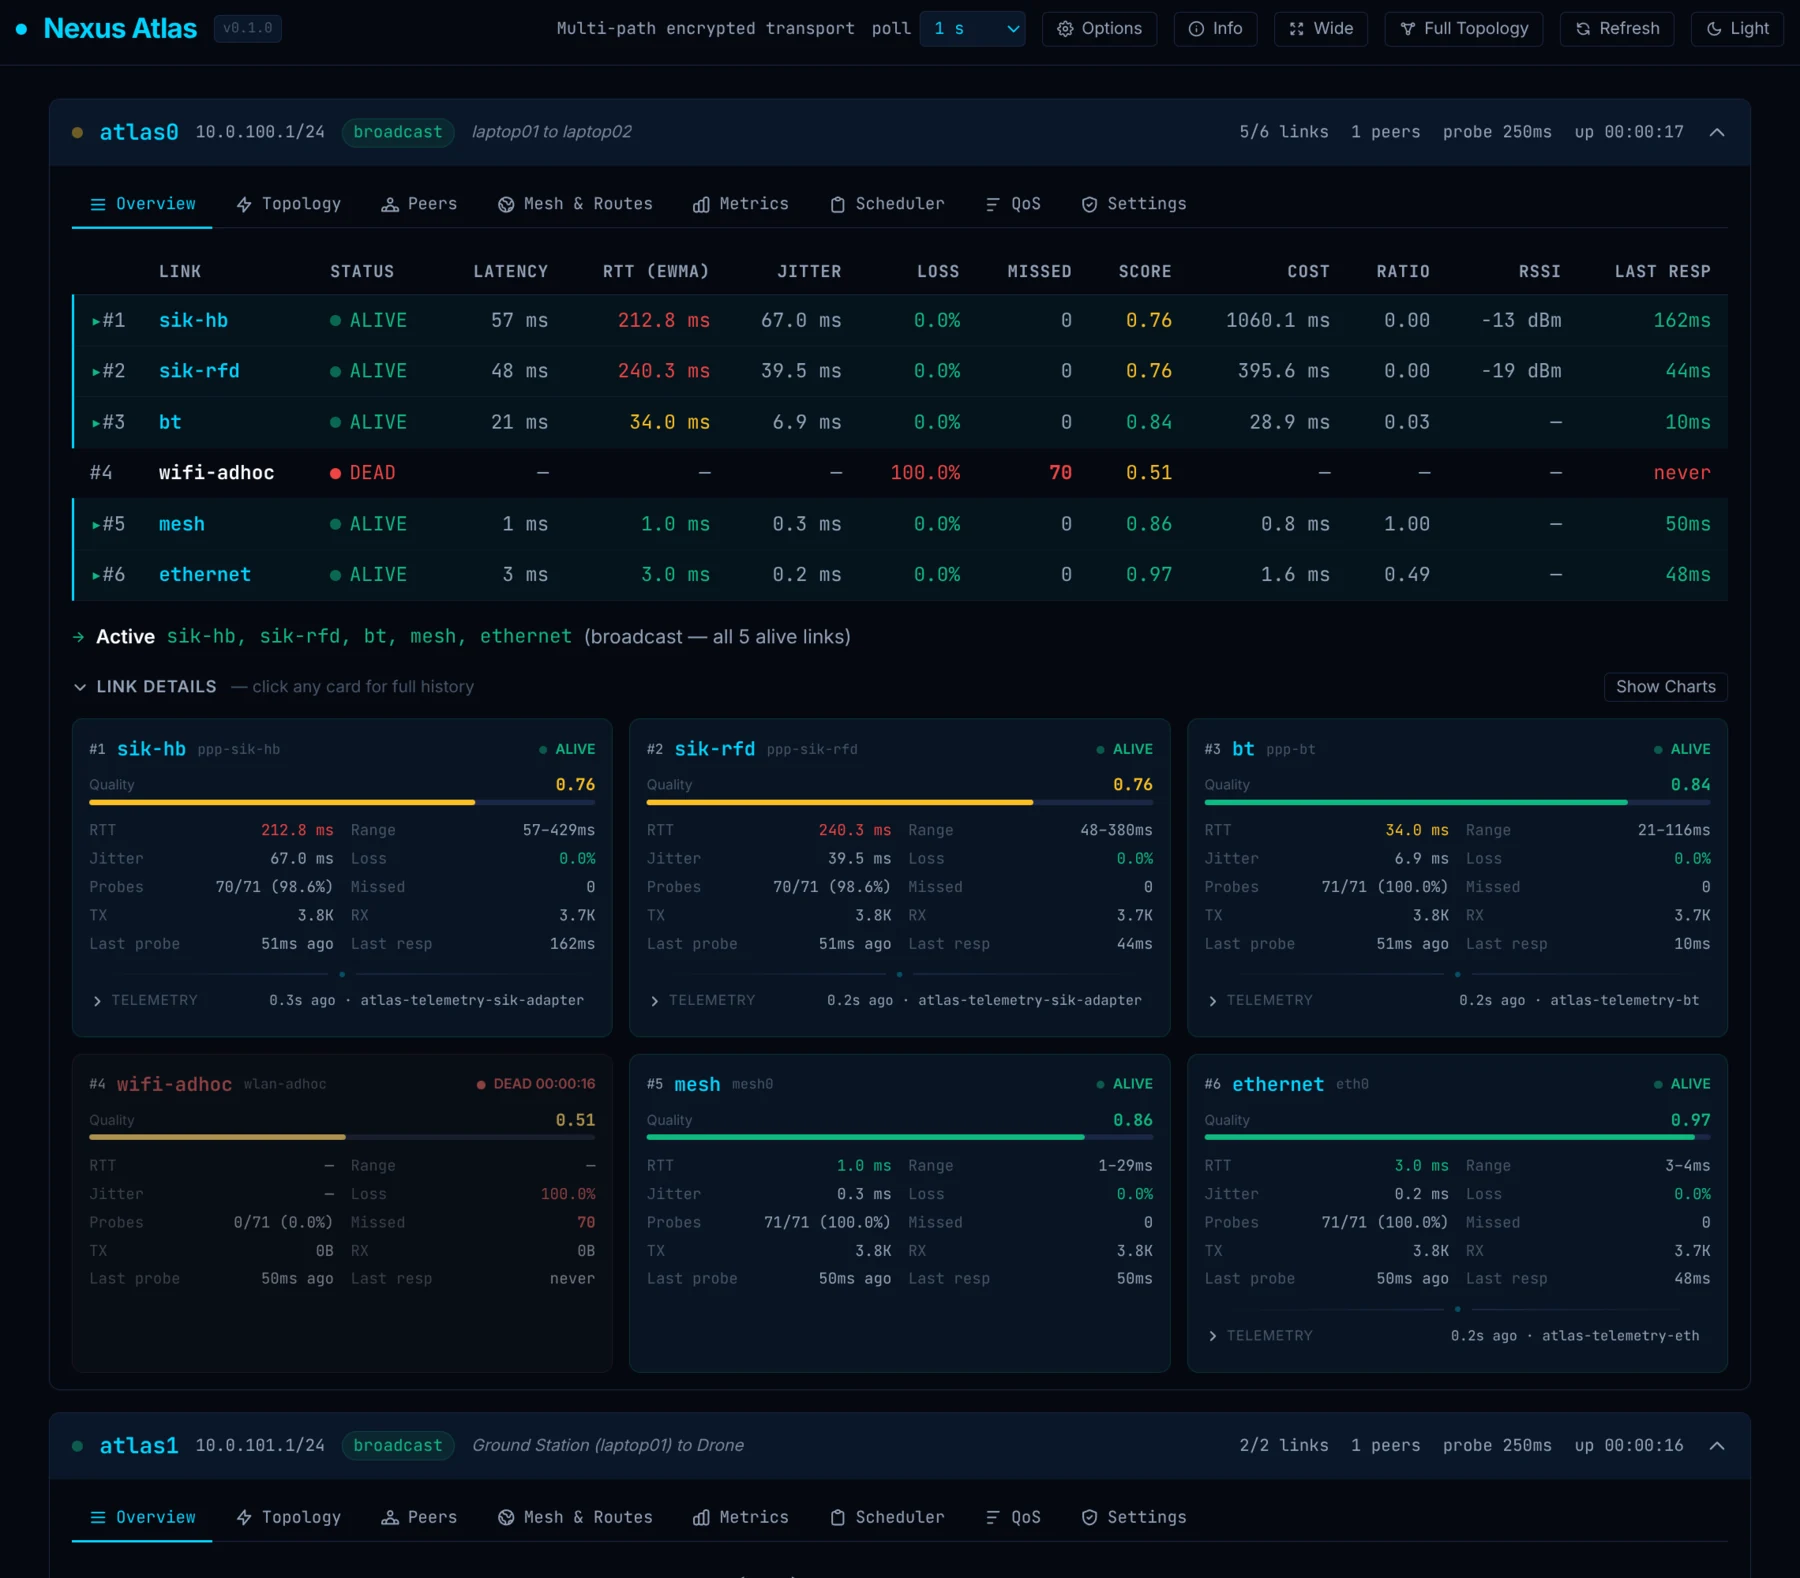
GET /metrics renders the snapshot the daemon already publishes as Prometheus/OpenMetrics text: atlas_link_up, atlas_link_rtt_seconds, atlas_link_loss_ratio, atlas_link_jitter_seconds, atlas_link_quality_score, per-link byte and probe counters, atlas_peer_session_established, atlas_qos_{enqueued,sent,dropped}_packets, the bonding-tax percentiles and the metered-link budget series. It is a formatter over the stats file, not a second collection path — no exporter process, no agent to keep alive on a node you cannot reach — and atlas_scrape_duration_seconds reports what the formatting itself cost. On by default at /metrics; [metrics] enabled = false answers 404.